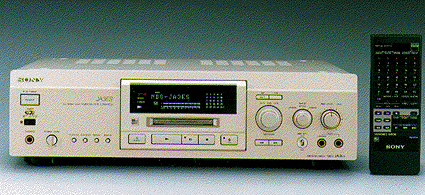

Since the appearance of the third generation signal processing IC, the sound quality of MD (MiniDisc) recorders has improved remarkably, high end component decks have appeared as well, and lately its popularity has rapidly increased. Because of the first generation product's peculiar nature (a fate misunderstood to be caused by MD's signal compression processing), hi-fi audio enthusiasts at the start simply ignored it. But the actual reason is different, and in reality MD itself held a latent potential sufficient for hi-fi use.
In order to find out about MD's fundamentals and its latest technology trends we conducted the following interview with the developers of the MDS-JA3ES component deck, Hiroe Tetsuya and Fujiyama Tadataka of Sony's Home AV division as well Wada Morio from Sony's Product Technology Information Department.
When developing DSP (digital signal processing) IC's, the IC's development is done with a computer, simulations are performed, and we check whether or not there are errors, also by computer. In the same way, we are able to listen to audio signals that have been simulated by computer. In this way we listened to sound compressed and decompressed by ATRAC before the development of the ATRAC IC. That sound was very good.
Hiroe: Again, even after MD was productized, using digital I/O (bypassing the MD recorder's built in A/D and D/A converters) you were able to listen to the ATRAC processed sound. It's sound compressed with ATRAC and then restored, and in fact it's great sound.
Because of this, if you ensure a sufficient signal processing word length, and have an accurate matching to your A/D and D/A word length, then even if you're talking about compression based media, you can get some great sound out of it.
Fujiyama: From the start ATRAC itself has had good sound, however in the initial products the related parts such as the A/D and D/A converters were not good enough.
Shibazaki: Was ATRAC's potential sound quality really that high? Conversely, weren't the 1st generation products that came out 3 years ago quite far from ATRAC's intended sound quality?
Fujiyama: ATRAC demands very complex computational processing, however at the time of the 1st generation machines, it was a processing load the ICs of that era couldn't really handle.
Hiroe: Three years ago personal computers were in the 80386 age. Presently we are in the move from the 80486 to the Pentium, processing power and speed have improved to where they can barely be compared with 3 years ago.
You can say the same thing about DSP ICs, currently it is possible to do very complex computational processing at high speed, and computational accuracy has improved notably as well. Furthermore, our algorithms (computation methods) also improve year after year.
Our MDS-JA3ES MD deck is equipped with a generation 3.5 ATRAC IC, but since the progress made in this generation is equivalent to that of the Pentium, and since it ensures 20 bit computational accuracy, it achieves a measured 120dB dynamic range.
Furthermore, MD sound quality has improved to this point because the A/D and D/A converter conversion accuracy has also improved, and it's been given new "Block Floating" technology.
Shibazaki: What has been the evolution of the ATRAC signal processing IC?
Fujiyama: In terms of our ICs, their generations and introduction dates are shown here:
| IC Generation | IC Part Number | MD Deck | Intro Date |
|---|---|---|---|
| ATRAC 1 | CXD-2527 | MDS-101 | 2/93 |
| ATRAC 2 | CXD-2531 | MDS-102 MDS-501 | 11/93 2/94 |
| ATRAC 3 | CXD-2536 | MDS-S30/S1 MDS-302 | 11/94 12/94 |
| ATRAC 3.5 | CXD-2536A | MDS-JA3ES | 6/95 |
Shibazaki: What is generation 3.5?
Fujiyama: It's an upgraded version of the generation 3 CXD-2536.
Hiroe: We actually wanted to give it a different designation, since when you stick on something like an "A" suffix it looks like a minor change. In the "Block Floating" technique we've adopted that I'll describe later on there has been a major improvement in performance.
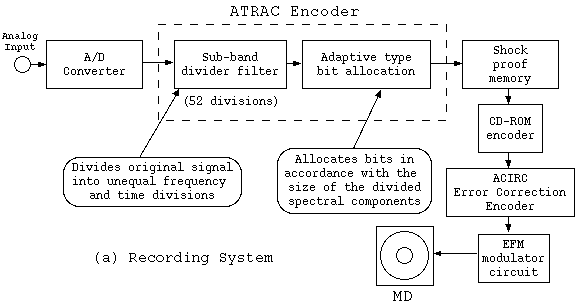
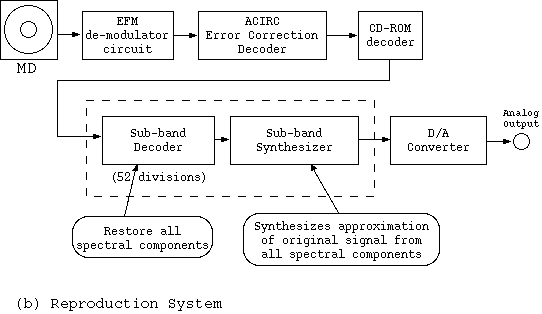
Figure 1. Basic Structure of MD System
Fujiyama: Yes, the basic makeup of course hasn't changed.
Shibazaki: In MD, the digital signal seems to be compressed to 2.8 bits however...
Fujiyama: This expression "2.8 bits" is misunderstood, in the final analysis this is the "time averaged" bit count. After spectral conversion, there are, for example, parts with 16 bits, parts with 3 bits, there are even sometimes parts with 0 bits.
Shibazaki: From moment to moment the bit count is changing?
Fujiyama: Right. So for instance if you have a 74 minute disc, the 74 minute time average will be 2.8 bits. It's not always 2.8 bits. This means that depending upon the incoming signal, the number of bits used is always changing.
Shibazaki: Is this like differential PCM?
Hiroe: No, [MD] data is processed in a bit bigger blocks. In differential PCM, at each 44.1kHz sampling the difference from the previous sample is sent, but in MD's case this isn't so, each time segment contains spectral bands, and data is assigned in this way.
Shibazaki: So for instance, in the case of a large signal which follows a tiny one, the recording is still just 16 bits, right?
Fujiyama: Right, in every 512 samples only the most important parts are given high resolution.
Hiroe: Again, in the case of signals which have few spectral components, because the empty parts of the spectrum are allocated to vertical axis resolution, the bit count increases. That is, even if there is little input the bits are used without wastage, filling in the handicap caused by compression.
Shibazaki: I see. Well, could you explain the specifics of that process.
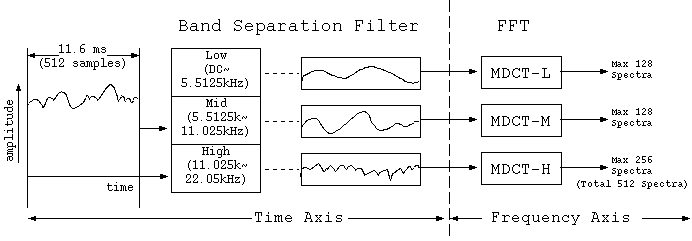
Figure 2. ATRAC Encoder Basic Concept Diagram
The input signal comes in and is, with something like a channel divider, divided into 3 bands, low, mid and high. This division into 3 bands is for the sake of reducing the load on the signal processing IC. Following this, these signals are each frequency converted with a so called MDCT.
Shibazaki: What's an MDCT?
Fujiyama: It's an abbreviation for Modified Discrete Cosine Transform. In short it's a type of orthogonal transform, which is now used for example in MPEG.
An orthogonal transform is, quickly speaking, an FFT method. Here, an FFT is performed separately on each of the mid, low and high bands.
Shibazaki: How is time divided up?
Fujiyama: Since it's 512 samples, that's roughly 11.6ms. The result of the fft is depicted in Figure 3. Therefore, though up through and including the filter's division into 3 bands it's been a time axis story, after the MDCT it becomes a frequency axis story.
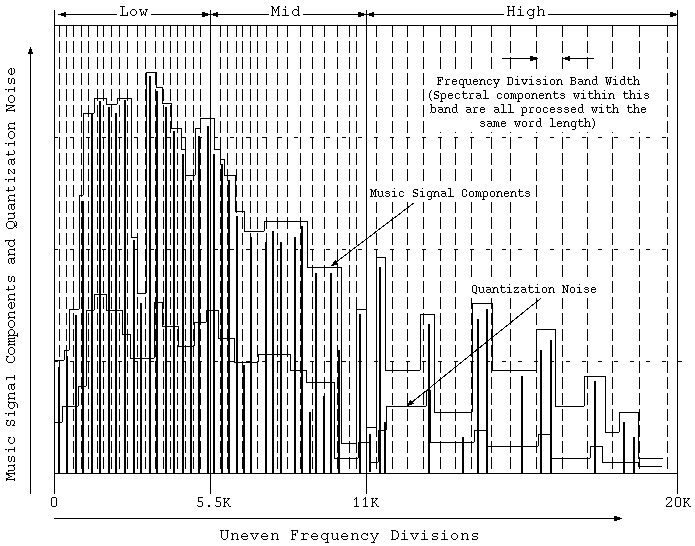
Figure 3. Decomposition of 512 (max.) Spectral Components
The FFT is done and many spectral components result. A maximum of 512 components come out, from 1 to 512, but they are divided up into 52 fixed bands. In other words, a maximum of 512 spectral components are divided and managed in a maximum of 52 bands.
Fujiyama: Yes.
Shibazaki: For example when the high band is empty?
Fujiyama: Right.
Hiroe: At those times, the vertical axis resolution is reassigned.
Shibazaki: So that it isn't wasted?
Hiroe: Right. So if, as before, we ask "How many bits?" it is extremely difficult to answer, because it's a matter of the vertical axis only, see?
Shibazaki: So then, in the case when a narrow range signal comes in it follows that the vertical axis resolution improves, right?
Hiroe: To speak of the extreme case, since when there is a sine wave like signal it is allotted full vertical axis resolution, if you measure the distortion on a simple signal it is extraordinarily low.
Shibazaki: So then, with things such as flute-like instrument solos which are akin to a sine wave, it follows that the resolution becomes really good, right?
Fujiyama: Right.
Shibazaki: People haven't really been informed of these things it seems ...
Wada: We had explained this before, but there seems to be few who understand it.
Shibazaki: Sorry. (laughing)
Fujiyama: Since most people are not familiar with this shift of concept from the time axis to the frequency axis, moving further afield from there can be difficult.
Fujiyama: At data compression time, perceptual phenomena such as the masking effect and the equi-loudness curve are used and we apply a weighting process. When this occurs, processing the 512 spectral components independently would be the best, but because of limitations such as processing speed, we can't. So, for convenience sake, we divide them into 52 so called critical bands and process them.
Shibazaki: In each of the 52 critical bands is the number of spectral components equal?
Fujiyama: No, in each band the number of spectral components is different. The masking phenomena is the same, but since in the low, middle, and high bands the effect is different, in order to divide the effect equally, the number of spectral components within each band is divided up. The decision is based upon auditory perception theory.
Fujiyama: In order to find how many spectral components are in the 52 divided bands, we first look for the largest spectral component. In correspondence with the largest spectral component's numerical value the scale factor is established.
Shibazaki: What's a scale factor?
Fujiyama: In MD, audio data is divided into its audio spectrum (AS) and scale factor (SF) and recorded.
In short, it's floating point, see? Because of this, AS is the value, SF is the index, AS and SF multipled together express the audio data. In contrast to this, CD is recorded as fixed point data.
Shibazaki: As a lengthly example, in the case where you want to express 1 micron, with CD this is 0.000001m with a lot of zeroes in a row. With MD it's 1.0 X 10⁻⁶. You are able to express it with fewer digits, right?
Fujiyama: Right. If you take the current example, 1.0 is the audio spectrum (AS), -6 is the scale factor (SF). In diagram 4 there is a concrete explanation of the ATRAC scale factor.
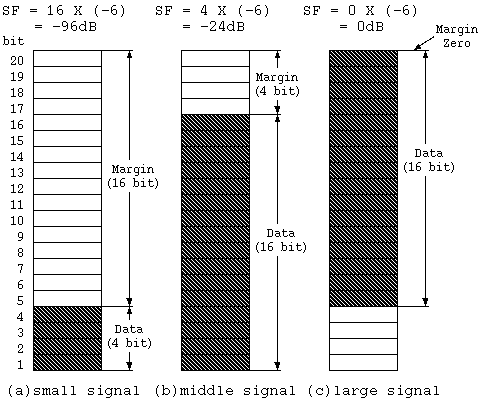
Figure 4. Scale Factor Concept
For example, according to diagram (a), in a 20 bit word-length, if you've got data that only uses the lower 4 bits, the highest part of that data is recorded as the scale factor. In this case the SF equals -96dB.
As the next diagram (b) shows, in the case of having data up to the 16th bit, the 16th bit is the scale factor, the SF becomes -24dB. In diagram (c), when you're using all the bits, the SF becomes 0.
In any case, the top part is the SF, and as much as 16 bits of spectrum data are the audio spectrum (AS), and the SF and AS in combination are recorded as audio data on an MD.
Shibazaki: So then, the scale factor can be thought of as the amount of shifting?
Fujiyama: The amount of shifting is the amount of inflation. If you use floating point, with a very small amount of information you can express a broad dynamic range. Besides, because the scale factor holds the dynamic range, even when tiny signals smaller than 16 bits arrive they are properly recorded.
Shibazaki: Can you think of this as being because data under 17 bits gets "bit shifted"?
Fujiyama: In short, "bit shift" is "floating". I will explain it while contrasting it with DAT.
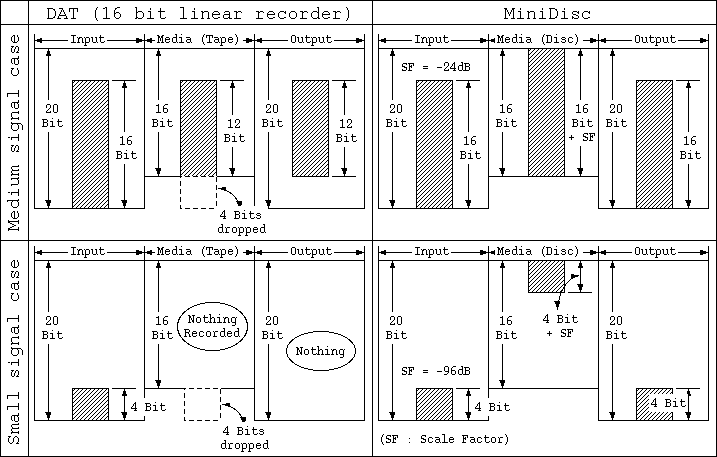
Figure 5. Explanation of MD's Wide Dynamic Range
Diagram 5 illustrates the difference in dynamic range between a DAT (representing a 16 bit linear recorder) and MD.
Assume we have an input bit width of 20 bits, that is, the digital input or A/D converter has a width of 20 bits.
First lets think about the case when a mid-level signal comes in. In the case of a 16 bit linear recorder such as a DAT or other PCM recorder, suppose that 16 bits worth of data residing in the bottom most part of the 20 bit word-length comes in. The media only has a 16 bit width, because of this, if the data is input just as it is, the bottom 4 bits of data will be lost. If this happens, then, at playback time, only the 12 bit part with the bottom cut off will be output.
In contrast to this, an MD recorder adjusts the incoming signal to the 16 bit media, that is to say, to the container, by shifting it up 4 bits worth (24 dB). Then, at playback time, it next shifts it down 4 bits worth. Because of this, incoming 16 bit data can be made use of just as it is.
Next, in the case of a small signal, for example in the case of using a 20 bit A/D converter with data appearing only in the bottom 4 bits, a DAT like linear recorder will, during the recording step, simply lop it off, and the sound will disappear.
In contrast to this, in MD's case, because internally the data itself is put into floating form, it is "floated up", recorded on the 16 bit media, and at output time is "floated down", as illustrated. Doing this, even a signal in the bottom 4 bit part of 20 bits can be reproduced.
Shibazaki: I see. It's because you can think of MD as always making use of the upper limit of the container (media). Thus in MD it has become possible to realize a dynamic range that exceeds CD and DAT?
Fujiyama: Right. The scale factor is held in 6 bits of the data, this allows from -120dB to +6dB of dynamic range to be expressed. And in so doing, if you only look at this, MiniDisc has in principal 126dB dynamic range.
Shibazaki: That's great!
Fujiyama: However, to realize this you'd have to use a DSP with an awful lot of processing power. Since the current products are not able to do that, it is of course less than that [126dB]. But, in the case of our MDS-JA3ES, based on the change to 20 bit I/O and the "block floating" computation we've adopted, a 120dB measured dynamic range has been realized, as shown in figure 6. This is THD+N (Total Harmonic Distortion + Noise) for the case of a 1.06808kHz signal recorded at -100dB, and extending across the entire audible band components other than 1.06808kHz are down -20dB.
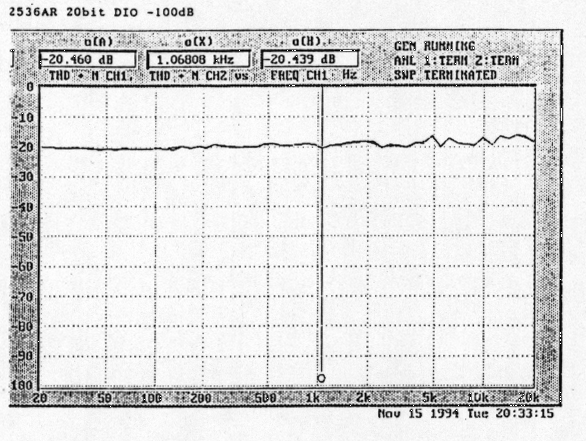
Figure 6. 1.06808kHz, -108dB Total Harmonic Distortion + Noise
Shibazaki: A -100dB signal with a noise floor of -20dB is properly a -120dB dynamic range, that is, it ensures 20 bits worth of dynamic range for a sine wave signal, right? This -100dB signal is without dither, right?
Fujiyama: Of course, there's no dither or anything like that being done. If you record a -100dB signal from the MDS-JA3ES's digital input and analyze the reproduced signal, the THD+N will be as shown.
In this way, the fft is done, after turning it into a spectrum, special auditory characteristics such as the masking effect and the equi-loudness curve are applied, and the unneeded parts of the spectrum are dropped.
Shibazaki: Even though they're omitted, this means that you're shaving off the components that human ears can't perceive, right?
Hiroe: Right. If you don't do that it won't fit in 2.8 bits, as you might expect.
Shibazaki: In correspondence with the masking curve, there are sometimes zeros, sometimes 6 bits, sometimes 10 bits. As illustrated in Figure 1, this is the adaptive bit allocation scheme. Up until this point has been an explanation of the functioning of the ATRAC encoder at recording time.
Fujiyama: It's one kind. Normal "bit shift", in other words "floating", means the sort of data that is shown individually in Figure 5. The condition in which all of the data is floating is what we call "floating". In contrast to this, shifting data in block units is "block floating".
The DSP used in ATRAC is, in the end, a fixed point DSP see, and because data itself can only be calculated in fixed point, if you use it just as it is you won't be able to make the dynamic range stuff work. Because of this, in thinking about whether we couldn't somehow use it for floating and shifting, we devised a way with an algorithm that could shift in block units. This is the "block floating" operation.
Shibazaki: Is a floating point calculation really that difficult?
Fujiyama: Difficult, and computationally expensive.
Hiroe: If you do everything on the same scale, the scale of the smallest units increase. Even in the case of personal computers you sometimes find co-processors necessary right? Fixed point is the simplest and cheapest way of accomplishing it.
Shibazaki: If you look at a major semiconductor manufacturer's DSP line up, suppose for example one fixed point DSP was 1000 yen, a floating point DSP is as much as 10,000 ~ 20,000 yen.
Shibazaki: An order of magnitude!
Fujiyama: For this reason floating point DSP's aren't really suitable for consumer use audio gear. So, we thought about a method for making a fixed point DSP do a floating point like calculation. Specifically, as we previously explained, 512 samples are taken as one block and divided into low, mid and high time axis bands, however the data is floating for each of these 3 blocks.
Shibazaki: From the MDS-JA3ES on you have started using "block floating"?
Fujiyama: Right. From the 3.5th generation ATRAC-IC on the "block floating" computation has been adopted.
Fujiyama: Right. Next, this spectrum information is transformed into time axis data. This means, in short, an inverse FFT is done.
Shibazaki: This means the spectrum is synthesized into a continuous wave shape?
Fujiyama: Right. Compared with recording, playback is simple. Since all you have to do is transform it just as it is, it's easy. This is because at recording time you have to think about which bits to drop and such, but at playback time those necessities don't exist.
As Figure 7 shows, data read off the disk is inverse FFT'ed via an IMDCT (inverse MDCT), the 3 separate bands are reassembled, and expanded time axis data is made. This completes the description of ATRAC's function.
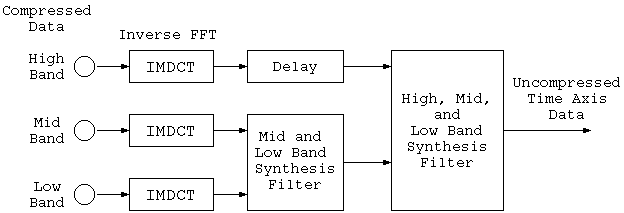
Figure 7. ATRAC Decoder Circuit Block Diagram
Shibazaki: ATRAC concerns aside, what general measures have been taken to improve sound quality?
In the case of digital recording equipment, a PLL (phase locked loop) operates via a VCO (voltage controlled oscillator) inside the digital audio interface, extracting the clock from the digital input signal. Normally the D/A converter is controlled with this VCO clock. However if you handle it this way, especially in the case of optical digital input, the sound quality is adversely affected by the influence of jitter. Therefore, the system used to remove these influences of jitter in the digital input signal is the "Direct Quartz Sync System" shown in figure 8, employing the sampling rate converter.
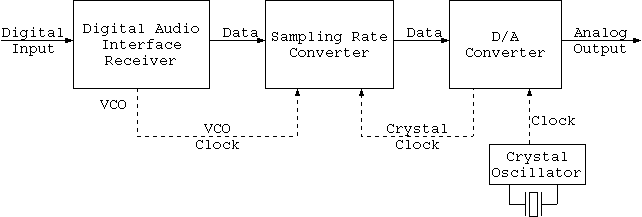
Figure 8. Direct Quartz Sync System
In this case the digital input signal passes through the sampling rate converter. In so doing, because the data is read from the D/A converter with the quartz standard clock that is right next to it, time axis correction occurs here. By doing this, jitterless, clean conversion becomes possible, and the D/A system's sound reproduction becomes clear.
Shibazaki: You are using the sampling rate converter as a jitter reduction device?
Fujiyama: That's one way of looking at it, but this is simply one consequence of using a sampling rate converter.
Shibazaki: Is there also an effect in the case when there is no sampling rate conversion?
Fujiyama: There is. Passing through the sampling rate converter, as you might in a sense expect, sampling rate conversion is done. It's sampling rate conversion from 44.1kHz to 44.1kHz.
Shibazaki: Then, is the digital input signal a bit different than the digital signal that has passed through the sampling rate converter?
Fujiyama: In a minute way, there is a difference. But, in the case of the MDS-JA3ES, since from input to output it's all 20 bits, 20 bit accuracy is preserved.
Shibazaki: Where is it different?
Fujiyama: As you might expect, even though we say 44.1kHz, the sending side's crystal accuracy and the receiving side's crystal accuracy are different. Since crystals for audio use have about 20 PPM error, the sampling point is also slipping slightly by that amount. From this comes a difference.
Hiroe: Critically speaking, in the case of recording from digital input, up until now recording and playback speeds have never been in agreement. This is because at recording time the source is relied upon. We say the source is 44.1kHz, but to begin with that 44.1kHz has some error. This means we set ourselves to this error when recording, see? On the other hand, since at playback time we are set to our own clock, from a close perspective, the frequency relationship between recording and playback goes haywire.
However, in the case of the "Direct Quartz Sync System", since the sampling rate converter's conversion is done with its own crystal as the entire standard, as long as its own clock's accuracy is correct, the frequency relationship between recording and playback is also correct.
Normally in REC pause mode, or during recording, incoming digital signals go out on digital out as is. But, if you push the REC button when there's no disk inside, it goes into input monitor mode, and a signal that has passed through the sampling rate converter is output on digital out.
Fujiyama: The white circles in Figure 9 are the input sampling points, the black squares are the output sampling points, however between these white circles the computation is done with 20 bit accuracy. Sampling rate conversion consists of picking out these black squares with 20 bit accuracy.
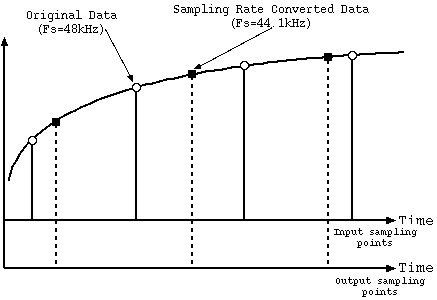
Figure 9. Sampling Rate Conversion
Fujiyama: Right. Figure 10 is the sampling rate converter's performance. Firm "A" and firm "B"'s sampling rate converter ICs are commercially available ICs.
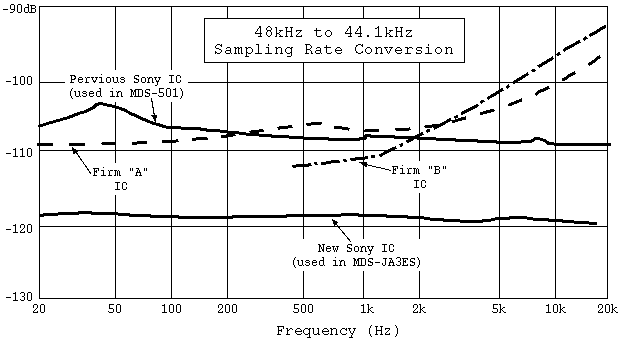
Figure 10. Sampling Rate Converter IC Performance and Comparison.
Shibazaki: Conversion error is held to around -120dB across the entire audible band, isn't it?
Fujiyama: What's especially different is the high band. Other company's conversion error is going up in the high band, however our IC has no loss of performance in the high band.
Shibazaki: This means you are able to maintain roughly 20 bit accuracy across the entire audible band, right?
Fujiyama: Right. The A/D converter is 18 bits but, since the digital input and output can take in 20 bits and spit out 20 bits, and ATRAC's contents are 20 bits as well, and the 1 bit type D/A converter also keeps 20 bit accuracy, the chief characteristic of the MDS-JA3ES is all the points which have had their bit width increased.
Shibazaki: Thank you very much for today's valuable talk.